Each year, reports such as those published by Cruise Lines International Association provide valuable insights into the cruise market, including passenger volumes and port call frequencies. These indicators are widely used across the industry and offer a clear view of scale and growth.
At the same time, they describe the market from the perspective of individual ports. They do not explain how cruise itineraries are actually constructed.
Cruises are not built around single destinations. They are assembled as sequences, combining a homeport with multiple ports of call into a coherent route. From an operational perspective, the key question is therefore not which ports are important, but which ports are used together.
From destinations to networks
When cruise lines design itineraries, they are effectively constructing a network. They consider the distance between ports, operational constraints, port costs and passenger appeal, but these decisions are typically not visible from the outside.
Related:Japan and South Korea’s cruise hub ambitions
If itineraries are built as combinations of ports, it should be possible to observe those combinations directly. This requires shifting the perspective from destinations to connections. Instead of counting how often a port is visited, the focus moves to how ports are linked within actual voyages.
Reconstructing itineraries from AIS data
To explore this, vessel movement data from AIS was used to reconstruct cruise itineraries in Northeast Asia over the period from May 2023 to April 2025. Each port call is treated as part of a sequence rather than an isolated event, allowing connections between ports to be identified.
By aggregating these sequences across multiple operators, recurring patterns begin to emerge. Ports that are frequently connected can be grouped together, revealing how itineraries are structured in practice.
To illustrate these connections, the network of cruise itineraries in Northeast Asia is visualized in this graphic:
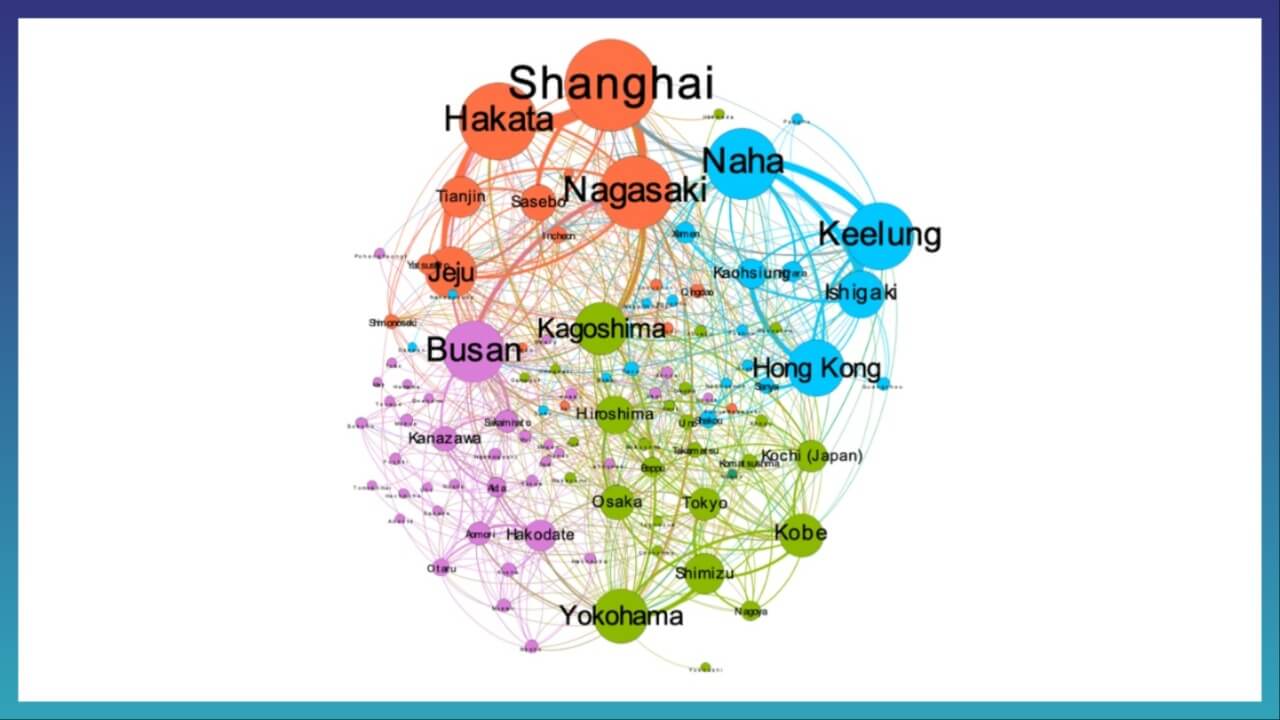
Northeast Asia cruise port clusters GRAPHIC: HIROHITO ITO
The analysis is based on AIS data tracking international ocean cruise ships over the same period, excluding domestic cruise operations. Each node represents a port, and links represent observed connections between ports within actual itineraries. Nodes shown in the same color belong to the same cluster, and the size of each node reflects the frequency of port calls.
Ports that are frequently used together are grouped into clusters using a modularity-based approach from network science, allowing strongly connected clusters of ports to be identified and the overall structure of deployment to be seen at a glance.
Related:StarCruises unveils three-night Hong Kong cruises to Kaohsiung and Penghu
Cluster-based structure of Northeast Asia
When the network is visualized, several distinct clusters emerge. Each cluster is anchored by a small number of dominant ports and reflects a different way in which itineraries are constructed in practice.
Shanghai-centered network
The largest and most structured cluster is anchored by Shanghai, which appears as one of the dominant nodes in the network. This cluster includes not only Chinese ports such as Tianjin, but also ports in Japan and Korea, including Nagasaki, Hakata, Sasebo, Jeju and Incheon.
The pattern suggests these ports are consistently combined within the same set of itineraries. Shanghai functions as the anchor of the system, while surrounding ports act as complementary destinations. Rather than forming separate national networks, these ports are integrated into a single itinerary structure centered on Shanghai.
Naha–Keelung–Hong Kong network
A second cluster is defined by large nodes at Naha, Keelung and Hong Kong. Ports such as Ishigaki, Kaohsiung, and Xiamen are also part of this network.
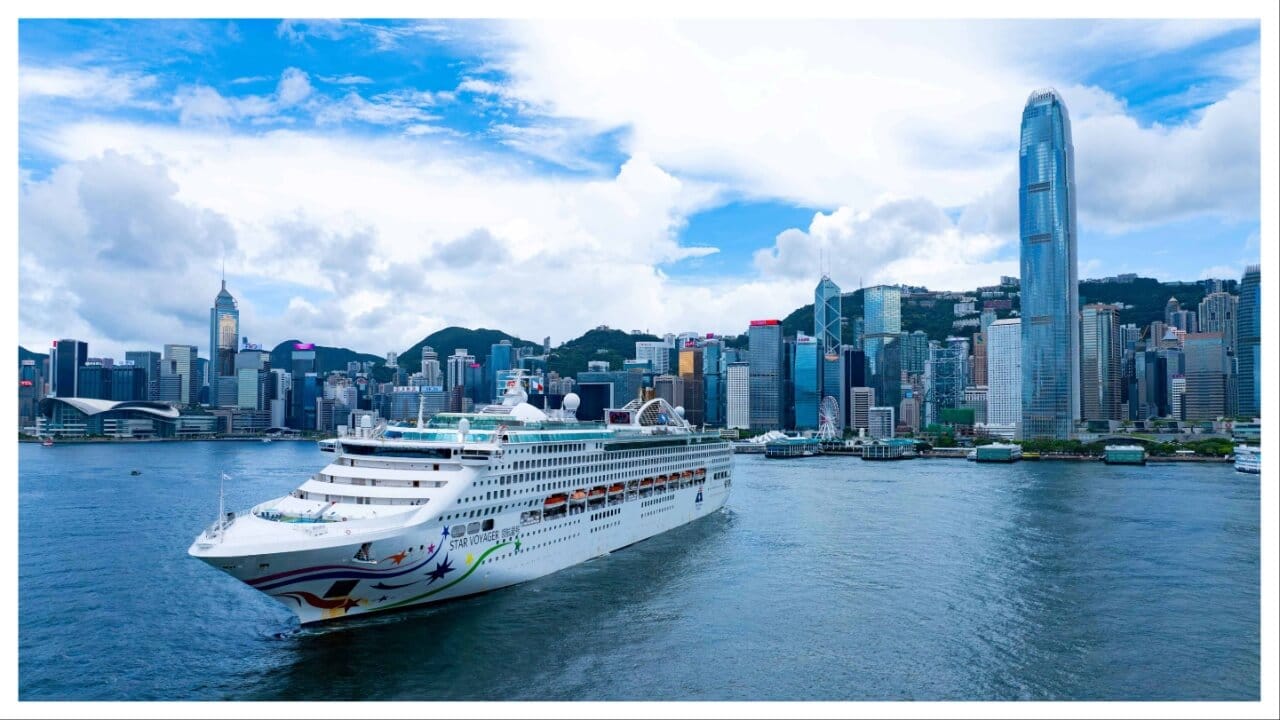
Star Voyager in Hong Kong PHOTO: STARCRUISES
Unlike the Shanghai cluster, this structure is not organized around a single dominant hub. Instead, it operates as a multi-core system linking Okinawa, Taiwan and southern China. The connections suggest a flexible itinerary structure that extends across the southern part of the region, with Naha and Keelung playing a more central role than is often assumed.
Related:Viking opens brand experience center in China
Yokohama–Kobe network
A third cluster is anchored by Yokohama and Kobe, forming the backbone of Japan-based itineraries. This cluster includes Osaka, Tokyo, Hiroshima, Kagoshima and Shimizu.
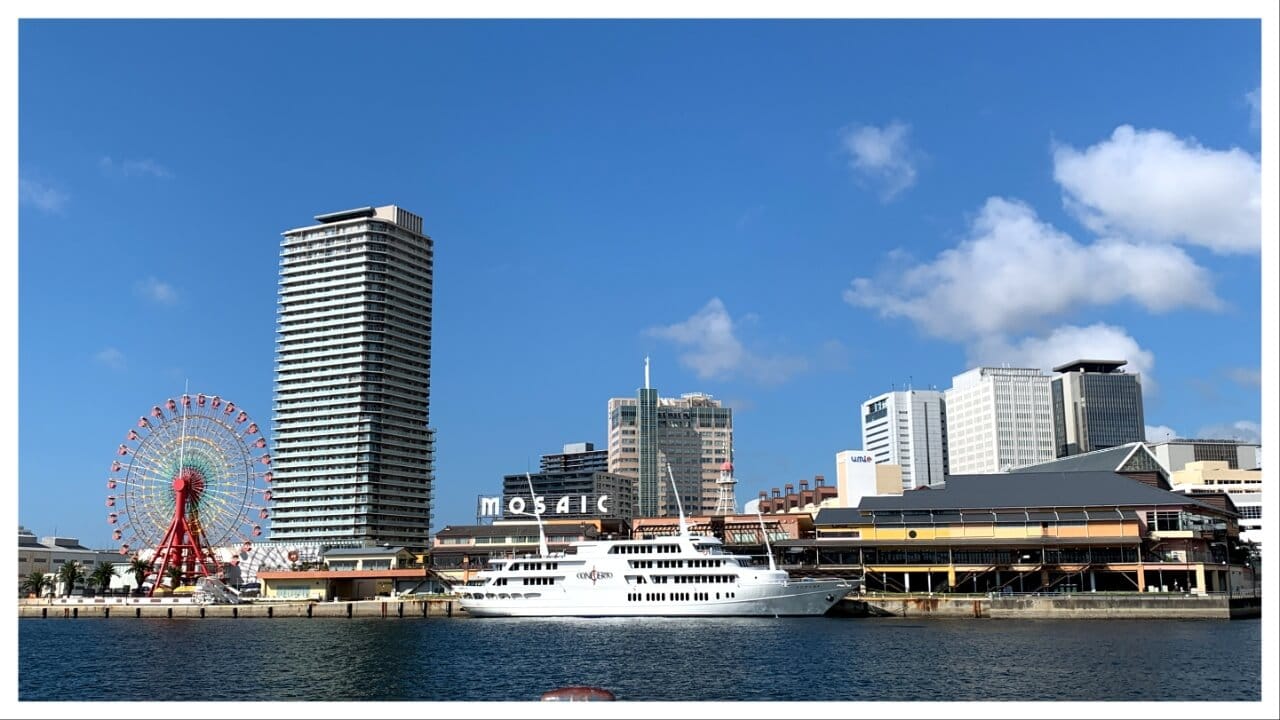
The view from Kobe’s Merikan Pier PHOTO: ANNE KALOSH
The connections within this group are relatively stable, indicating these ports are frequently combined in domestic sequences. Ports such as Kagoshima and Shimizu are not simply secondary stops, but part of a repeatable itinerary structure that supports Japan-focused deployment.
Busan-centered northern network
A fourth cluster is centered on Busan, which is connected to ports along the Japan Sea side, including Hakodate, Kanazawa, Aomori and Akita, as well as Sakaiminato and Otaru.
This cluster is distinct from the Shanghai-centered and southern networks. Notably, Busan is not grouped with Jeju or Incheon, indicating that Korean ports do not form a single unified system. Instead, Busan appears to function as a hub for a northern routing pattern linking Korea with northern Japan.
What this structure shows
Taken together, these clusters show that cruise deployment in Northeast Asia is organized around a limited number of recurring itinerary systems. These systems do not align with national boundaries, and ports within the same country can belong to entirely different clusters depending on how they are used.
Large ports such as Shanghai, Naha, Keelung, Hong Kong, Yokohama, Kobe and Busan play a central role in defining these systems, not only in volume, but through their position within the network.
Practical use for cruise lines
For cruise lines, this perspective provides a way to observe how itineraries are structured across operators. It becomes possible to benchmark deployment not only at the level of individual routes, but at the level of entire itinerary systems. This makes it easier to identify which combinations of ports are already well established and where there may be opportunities to introduce alternative patterns.
Practical use for ports
For ports, the implications are equally direct. Each port can be understood not as an isolated destination, but as part of a group of ports that are actually combined in itineraries. This affects how ports position themselves and how they approach collaboration. In many cases, working with ports that are already part of the same cluster may be more effective than promoting a port individually.
Conclusion
Cruise deployment in Northeast Asia is structured in recurring combinations of ports that form identifiable clusters. These clusters define how itineraries are constructed in practice.
What matters is not only where ships go, but how ports are combined into itineraries.
Understanding these patterns provides a more practical basis for both cruise lines and ports to make decisions within the regional system.

Hirohito Ito, director of the Cruise Research Laboratory at Central Consultant Inc. PHOTO COURTESY OF HIROHITO ITO